Admin analytics — what it returns and how it works¶
Audience: operators, finance, BI, and engineers who need to know what the admin dashboard numbers mean and where they come from. What this is: a step-by-step walk of the admin-fe analytics surface — every panel, the exact endpoint that feeds it, and the SQL-level definition of each metric. Captured live against the running stack (admin-fe Vite SPA → ebit-api
:4000).
The analytics suite as a product capability¶
Analytics is a first-class part of the platform we ship — not an internal afterthought. Out of the box the operator gets a complete, real-time view of casino economics:
- Player economics — active players, ARPU/ATPU, average bet, bet frequency (ABCPU).
- Revenue — turnover, GGR, NGR (bonus-adjusted), and house margin %.
- Game & provider breakdowns — per-game and per-provider turnover/GGR with comparative share charts.
- Money flows — deposits, withdrawals, tips, and registration funnels over time.
- Geo & compliance — allow/block country split.
Every figure is derived server-side from the live bet and payment ledgers (no client-side estimation), filterable by period, and surfaced through the 16 endpoints catalogued below — all 16 captured live and returning 200 in this walkthrough. The sections that follow show each panel, its screenshot, the feeding endpoint, and the exact metric definition, so the capability can be demoed and explained to a customer end to end.
The admin analytics live in two sidebar entries — Overview (/) and Dashboard (/dashboard, four tabs: General · Games · Finances · Reporting). Every analytics call is GET /admin/dashboard* and is guarded by JwtGuard + PermissionGuard('dashboard.view') (controllers: apps/api/src/dashboard-v2/admin.dashboard-{separated,combined}.controller.ts + apps/api/src/dashboard/).
Metric glossary (the load-bearing definitions)¶
Every games KPI is computed in one SQL SELECT over the bet table — apps/api/src/dashboard-v2/repository/common.sql.ts:52-68. The exact expressions:
| Metric | Meaning | SQL |
|---|---|---|
| active_players | distinct players who bet in the window | COUNT(DISTINCT b.user_id) |
| bet_count | number of bets | COUNT(b.id) |
| turnover | total wagered (USD) | SUM(b.usd_amount) |
| GGR | Gross Gaming Revenue = wagered − paid out | SUM(usd_amount) - SUM(usd_payout) |
| NGR | Net Gaming Revenue = GGR − bonus/rakeback claims | GGR - (instant + daily + weekly + monthly total_claimed) |
| ATPU | Average Turnover Per User | turnover / NULLIF(active_players, 0) |
| ARPU | Average Revenue Per User | GGR / NULLIF(active_players, 0) |
| margin | house margin %, GGR as a share of turnover | GGR / NULLIF(turnover, 0) * 100 |
| ABCPU | Average Bet Count Per User | bet_count / NULLIF(active_players, 0) |
| averageBetSum | mean bet size (USD) | AVG(b.usd_amount) |
All money figures are USD-converted (b.usd_amount / b.usd_payout — the FX is stamped per-bet at settlement, see ../flows/dropbet-bet-place.md §4.4). Bets are bucketed by settled_at, not created_at.
Why NGR can be hugely negative. NGR subtracts every bonus/rakeback/leaderboard payout from GGR. On a seeded dev DB a leaderboard payout of 1,010,000 against a GGR of 0.61 yields NGR ≈ −1,009,999 — that's correct arithmetic on test data, not a bug.
Overview (/) — GET /admin/dashboard/quick-stats¶
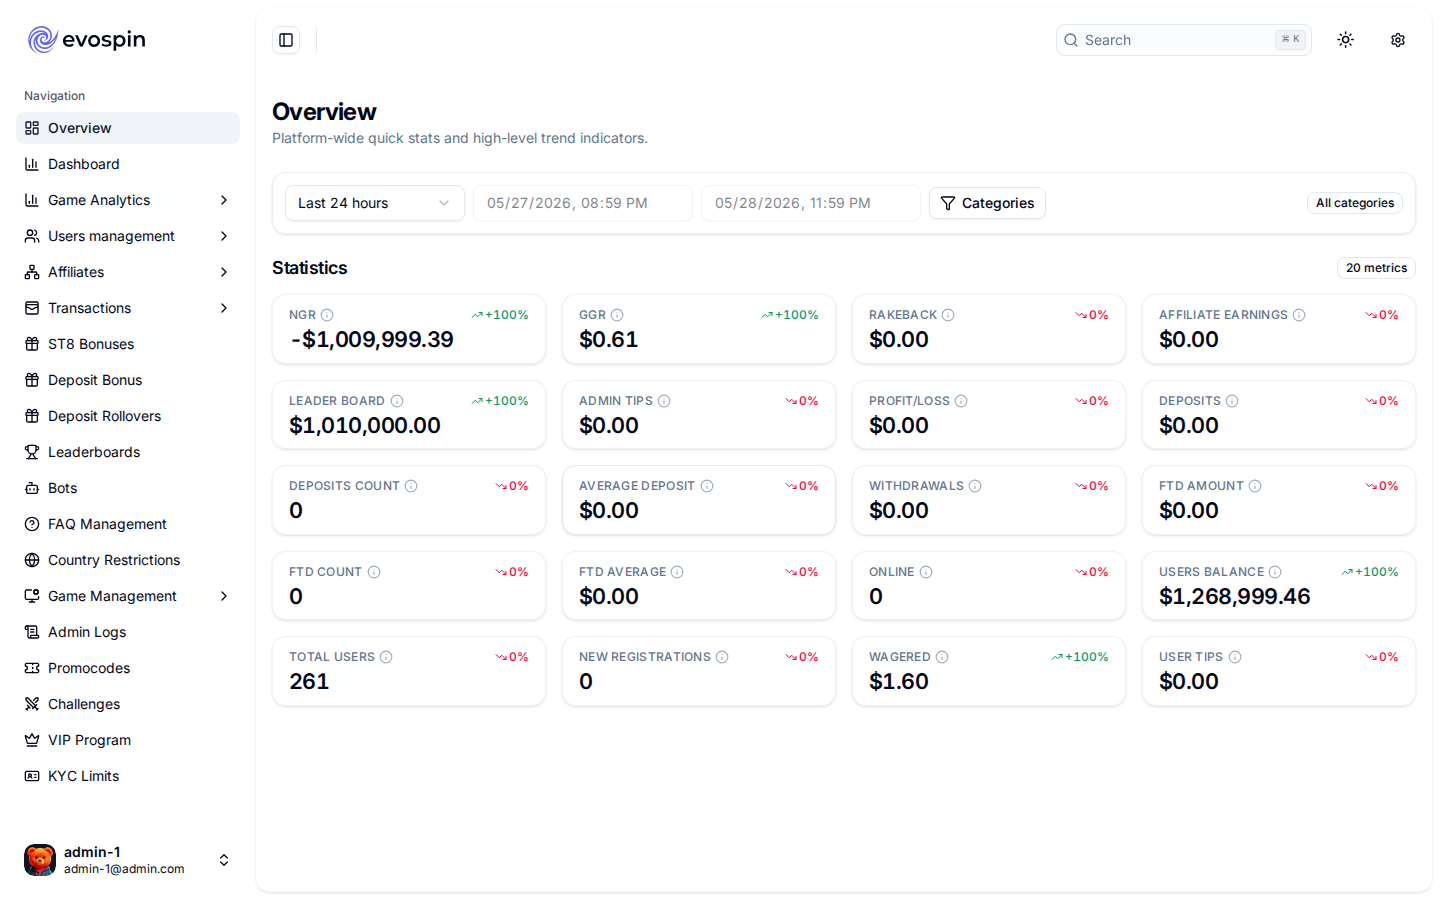
A single call returns an array of { result: { data, percent, previous_period }, query } — one entry per headline metric. The percent is the period-over-period change vs previous_period.
Queries returned (CQRS handlers under apps/api/src/dashboard/repository/query/):
query |
Metric |
|---|---|
NgrQuery |
Net Gaming Revenue |
GgrQuery |
Gross Gaming Revenue |
RakeBackProgramQuery |
rakeback paid out |
AffiliateClaimedQuery |
affiliate commission claimed |
LeaderBoardQuery |
leaderboard prizes paid |
AdminTipsQuery |
admin-issued tips |
ProfitLossQuery |
P/L |
UserTotalDepositsAmountQuery / …Count / …Average |
deposit volume / count / mean |
Params: ?startDate=<ISO>&endDate=<ISO>.
Dashboard → General — three time-series calls¶
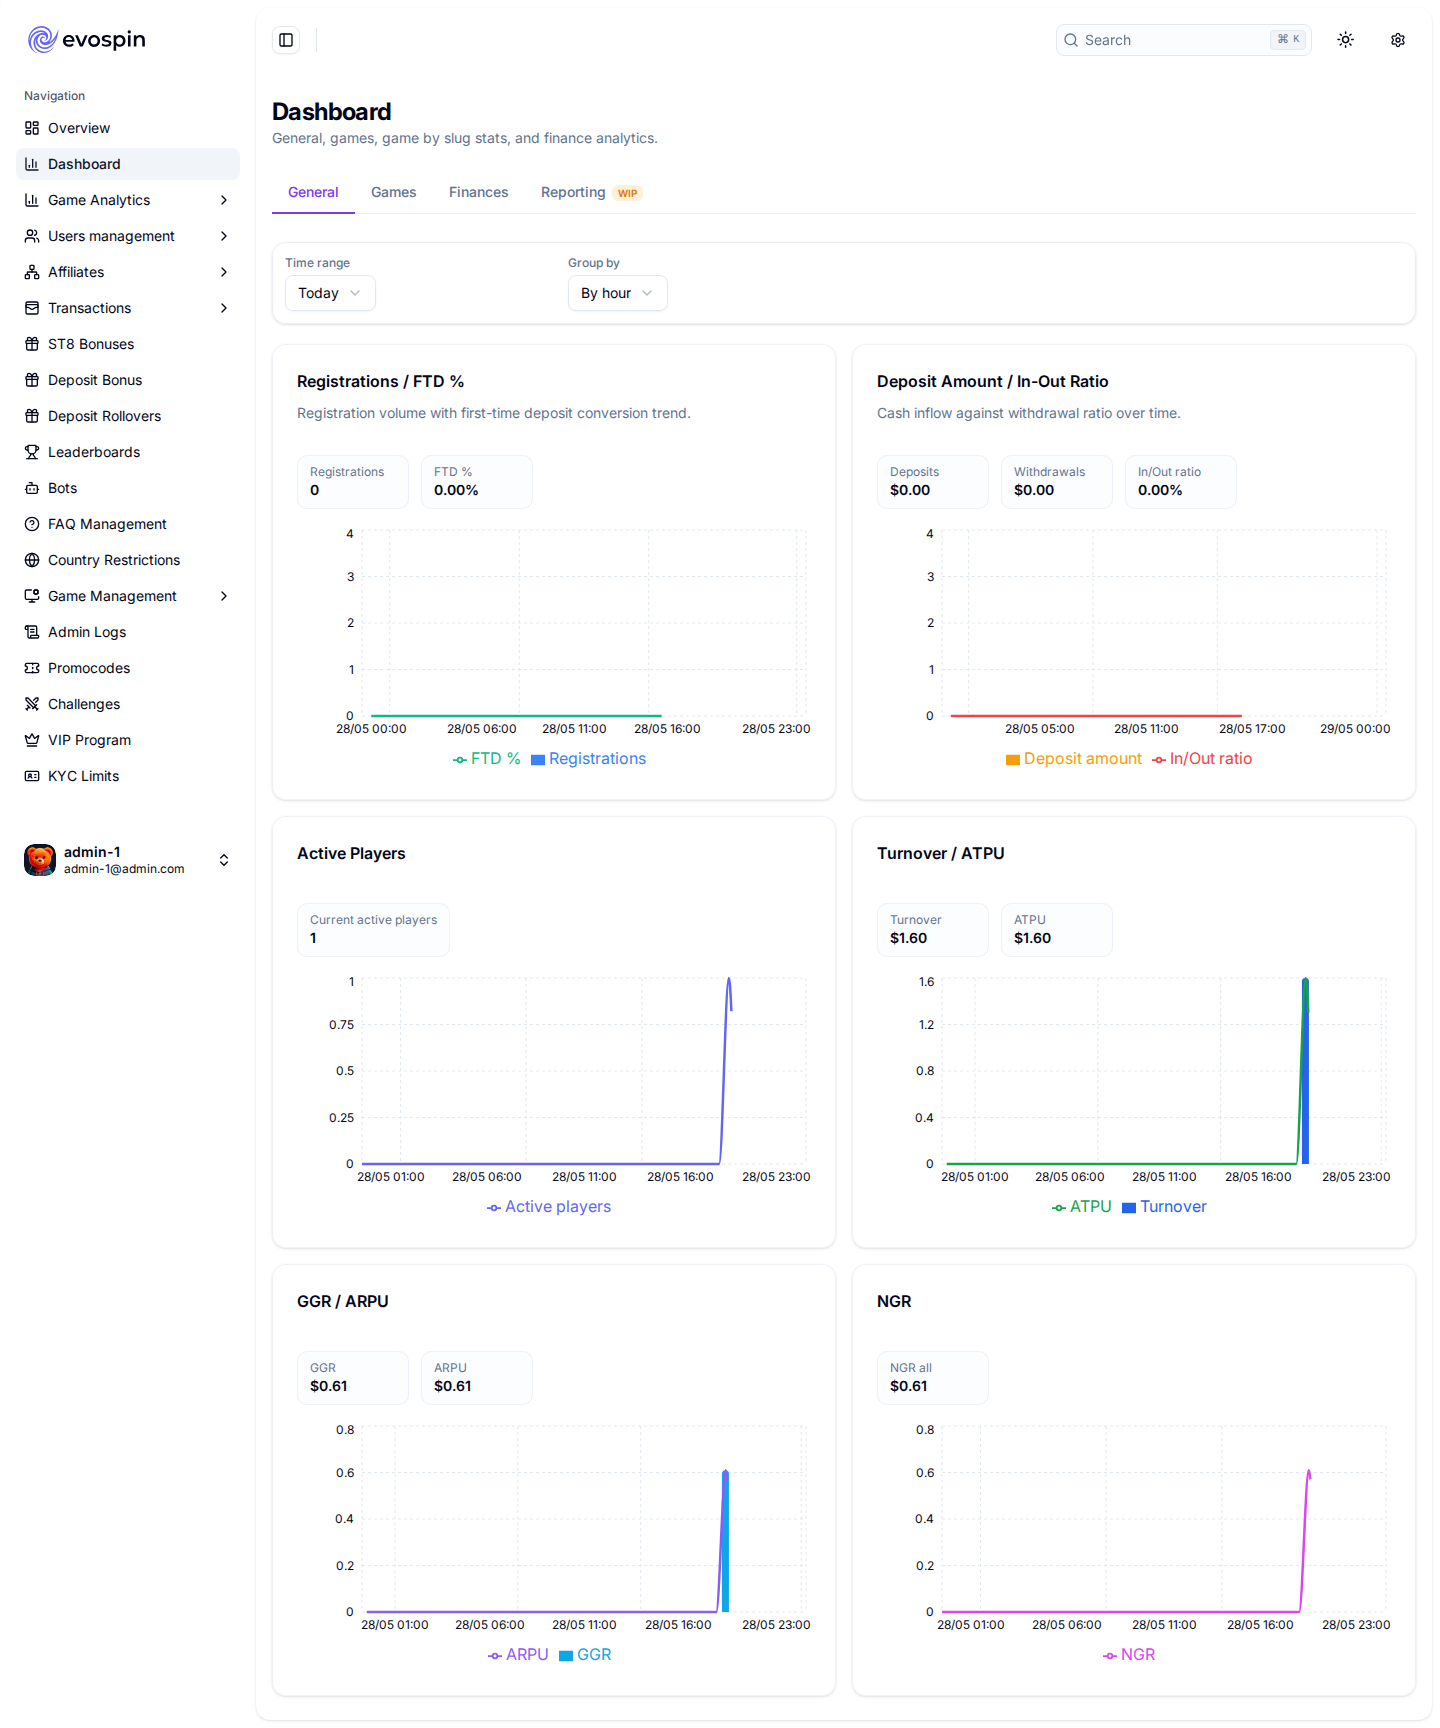
The General tab fires three parallel queries, all keyed by ?timeRange=Today&timeGroup=hour (timeRange ∈ Today/Last7Days/…; timeGroup ∈ hour/day):
| Panel | Endpoint | Response shape |
|---|---|---|
| Registrations / FTD % | GET /admin/dashboard-v2/query/registrations |
{ registrationCount, registrationTimeSeries: [{time, count}] } |
| Deposit Amount / In-Out Ratio | GET /admin/dashboard-v2/query/payments |
{ depositAmount, depositAmountTimeSeries: [{time,count}], withdrawal series… } |
| Active Players · Turnover/ATPU · GGR/ARPU · NGR | GET /admin/dashboard-v2/query/bets-by-type |
{ activePlayersTimeSeries, turnoverTimeSeries, atpuTimeSeries, ggrTimeSeries, ngrTimeSeries, … } — each [{time, count}] |
bets-by-type is the time-series sibling of games-by-type: same KPI SQL, but emitted per time-bucket (via generate_series over the window) instead of one total row. Service: dashboard-separated.service.ts:getBetsByType.
Dashboard → Games — KPI block + per-slug table¶
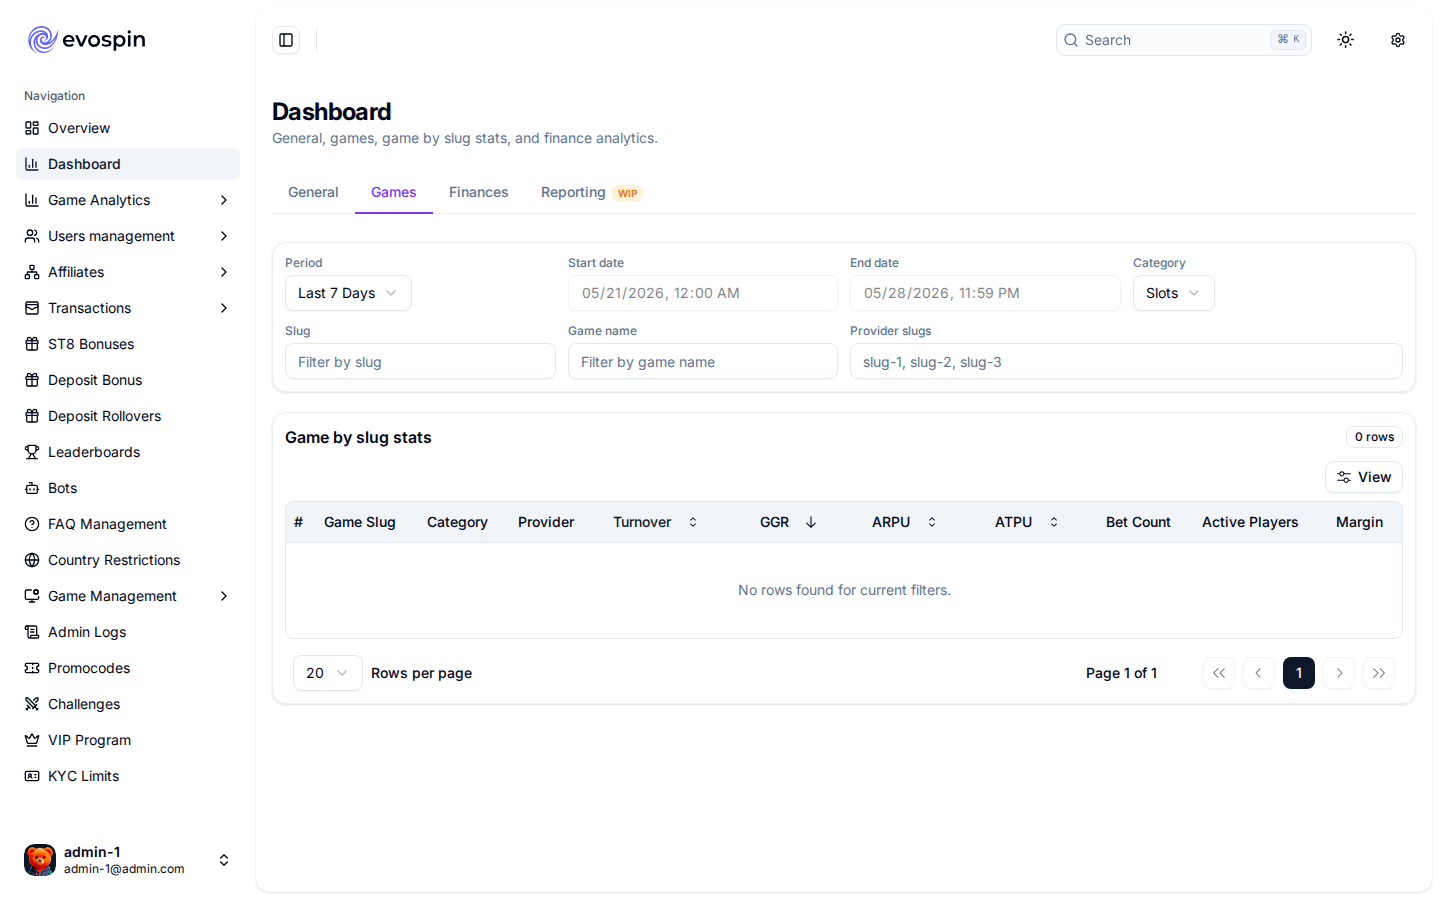
Two calls:
1. KPI summary — GET /admin/dashboard-v2/query/games-by-type (?timeRange=Today&timeGroup=hour). Returns the single totals row plus two pie breakdowns:
{
  "activePlayers": 1, "turnover": 1.6, "atpu": 1.6,
  "ggr": 0.61, "arpu": 0.61, "margin": 38.125,
  "betCount": 16, "abcpu": 16, "averageBetSum": 0.1, "ngr": 0.61,
  "gameTypeMarginPie":   [{ "type": "HOUSE_GAME", "value": 38.125 }],
  "gameTypeTurnoverPie": [{ "type": "HOUSE_GAME", "value": 1.6 }]
}
The SQL uses GROUP BY GROUPING SETS ((), (b.type)) — the () set is the grand total (the KPI block), the (b.type) sets feed the per-type pies (HOUSE_GAME / SLOTS / etc). Service: dashboard-separated.service.ts:getGamesByType → SeriesUtils.toGameAnalytics.
2. Per-slug table — GET /admin/dashboard-v2/query/games-by-slug (?timeGroup=day&timeRange=Last7Days&gameCategory=SLOTS&orderBy=ggr&orderDirection=desc&page=1&take=20). Paginated breakdown — one row per game slug with the same KPIs plus gameSlug / gameName / providerName / gameCategories:
Sortable by any KPI (orderBy=ggr|turnover|…), filterable by category / slug / game name / provider.
Dashboard → Finances — GET /admin/dashboard/finance-tab¶
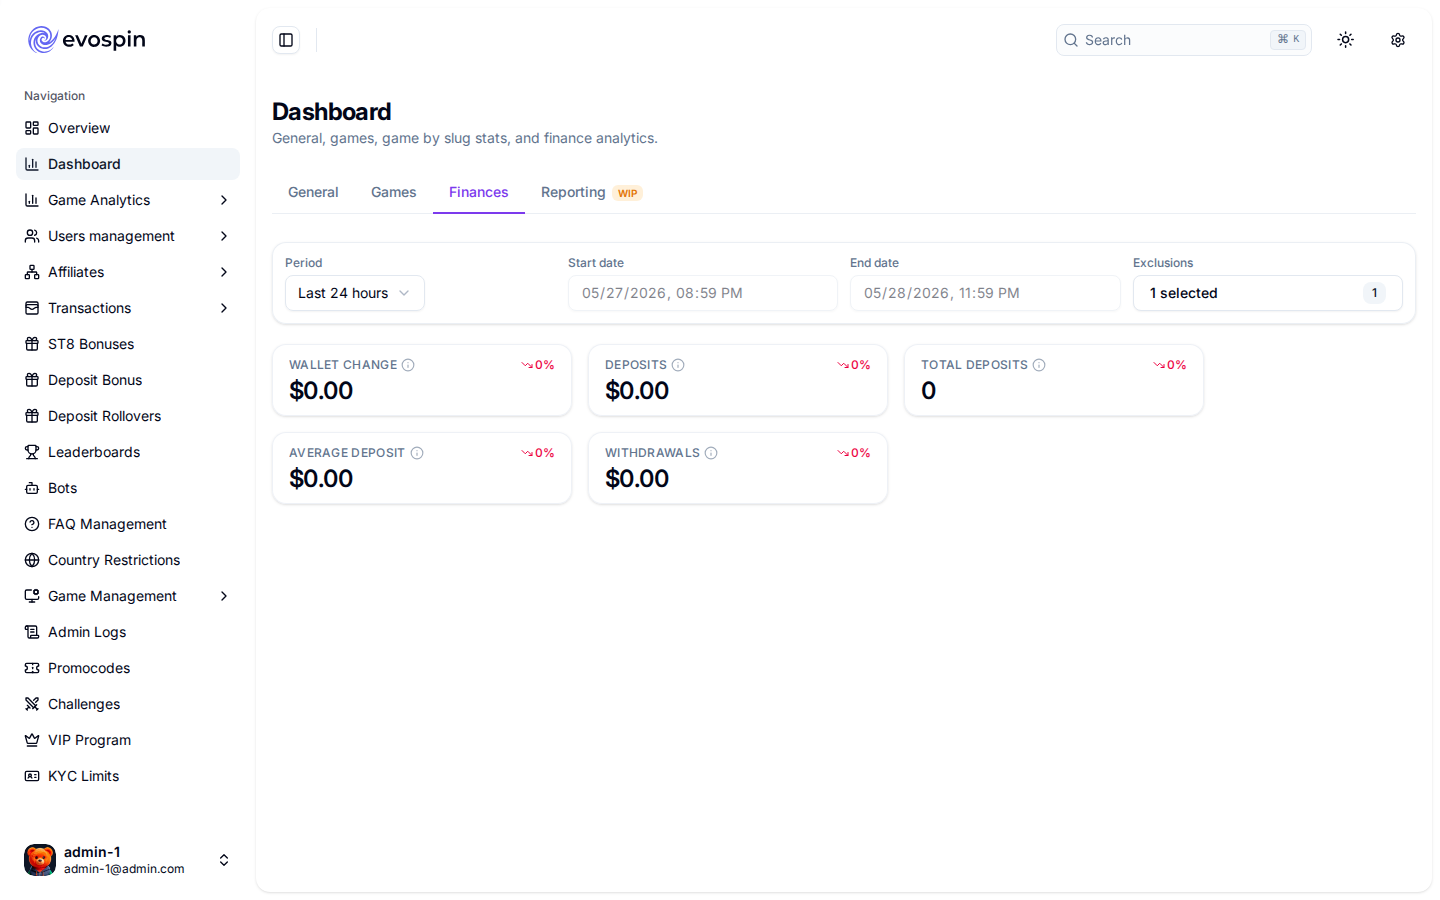
Same { result, query }[] shape as quick-stats, scoped to money movement. Distinctive feature: exclusion filters in the params — ?excludeAdmin=false&excludeTest=true&excludeStaff=false&excludeStreamer=false. These strip internal/test cohorts from the figures so finance sees real-player numbers.
Queries: ProfitLossQuery, UserTotalDepositsAmountQuery, UserTotalDepositsCountQuery, UserTotalDepositsAverageQuery, UserTotalWithdrawalsQuery. Panels: Wallet Change · Deposits · Total Deposits (count) · Average Deposit · Withdrawals.
Dashboard → Reporting¶
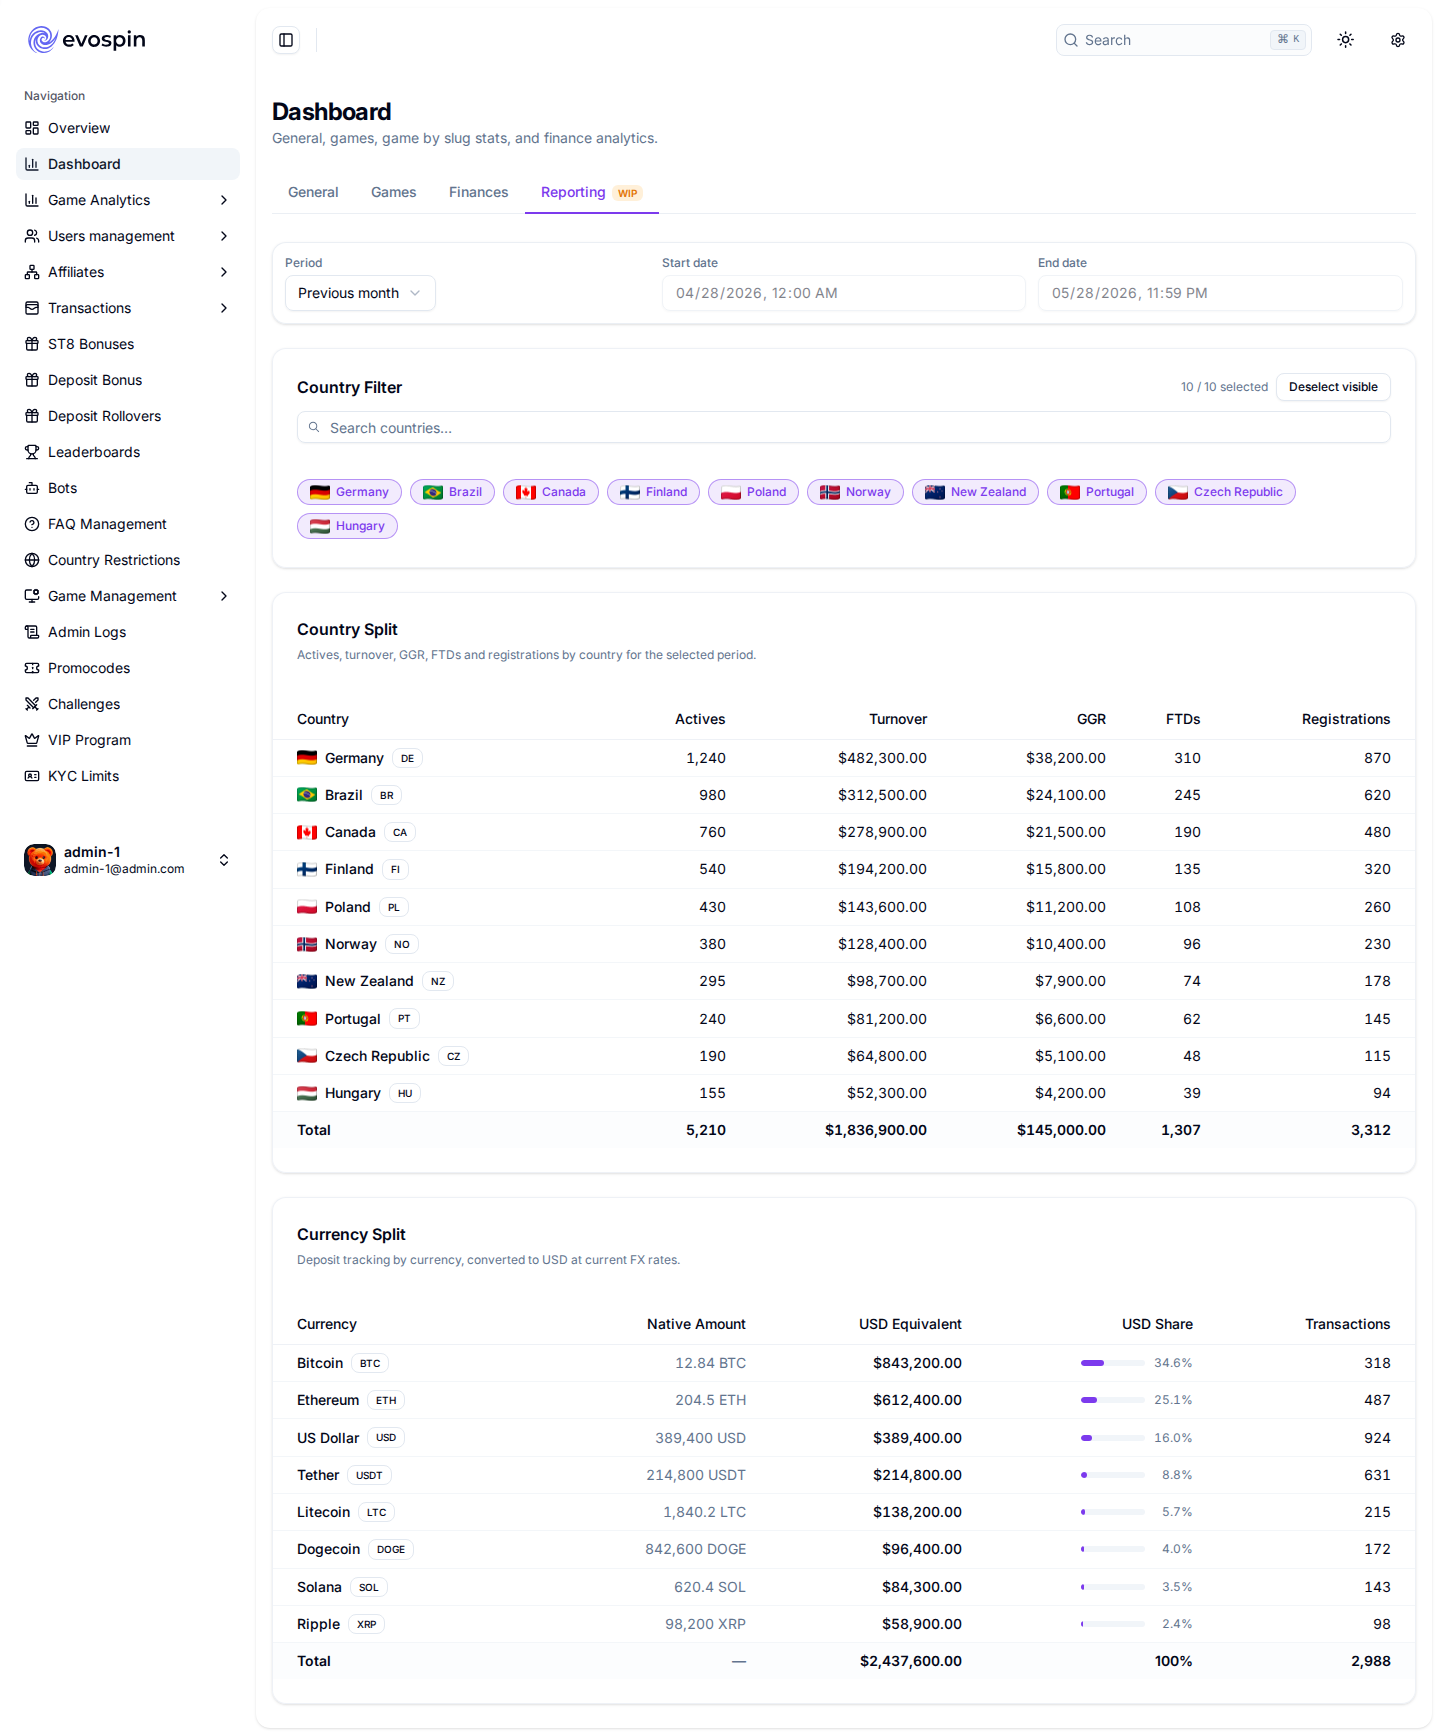
Marked WIP in the UI — no endpoint fires; placeholder for a future export/report builder.
Game Management stats — GET /admin/dashboard/games-stats¶
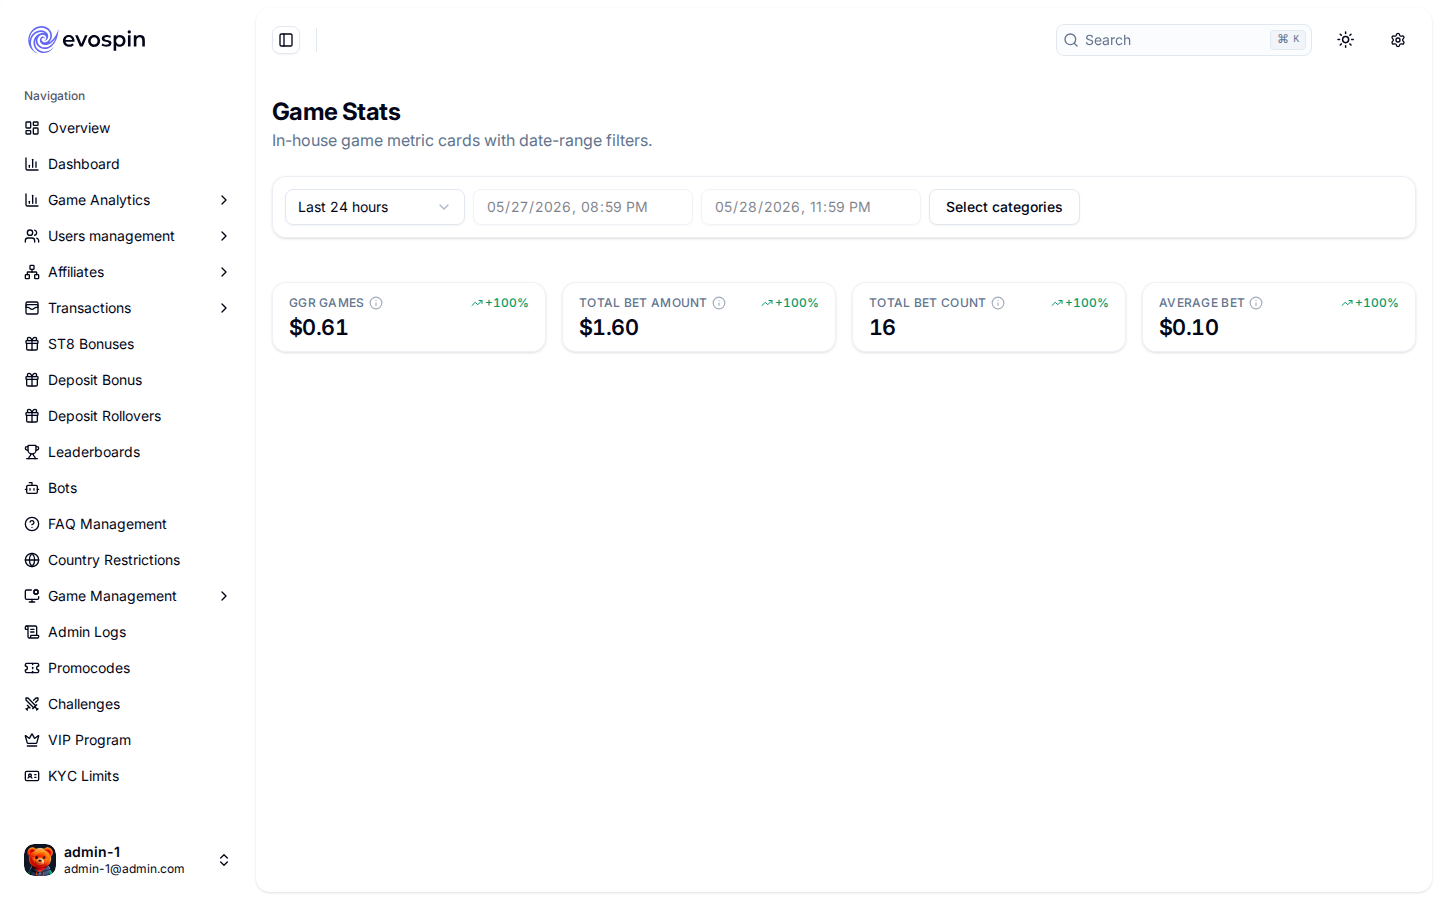
Separate from the dashboard-v2 surface. Returns the { result, query }[] shape with games-scoped queries: GgrGamesQuery, GamesTotalBetAmountQuery, GamesTotalBetCountQuery, GamesTotalBetAverageQuery. Sibling endpoints games-charts and providers-stats feed the chart + provider breakdown on the same page.
Per-section stats (outside the Dashboard surface)¶
Several admin sections carry their own summary-stat strip above their tables. Separate endpoints from the dashboard-v2 surface, all captured live.
Users management — GET /admin/dashboard/users-stats¶
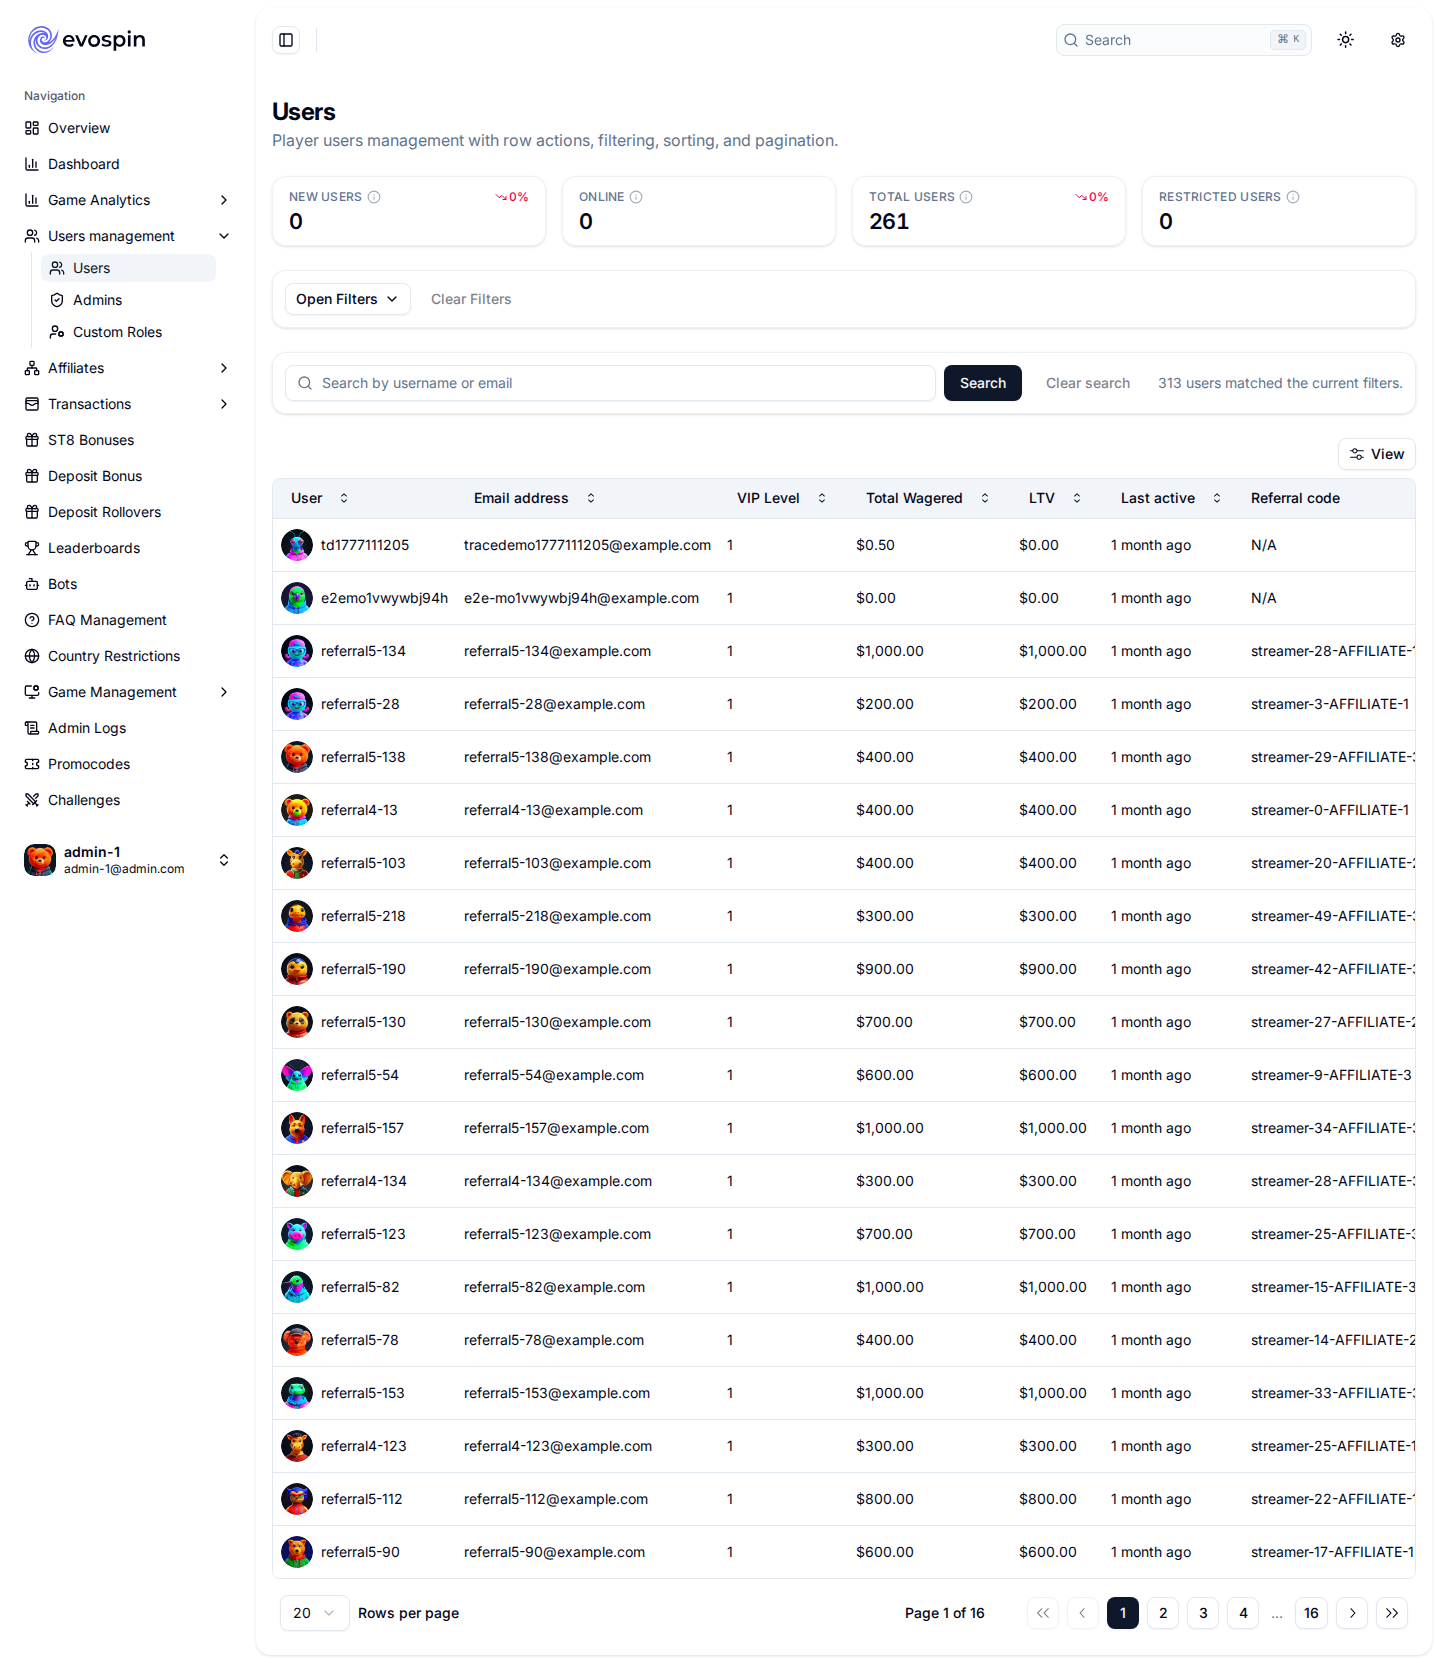
Flat object (not the {result,query}[] shape): { newUsers: {data,percent}, totalUsers: {data,percent}, restrictedUsers, onlineUsers }. Drives the New / Total / Online / Restricted counters above the user table. onlineUsers here is the raw count (distinct from the inflated WS broadcast — AF-5 in ../weaknesses-register.md).
Affiliates — GET /admin/dashboard/affiliate-stats¶
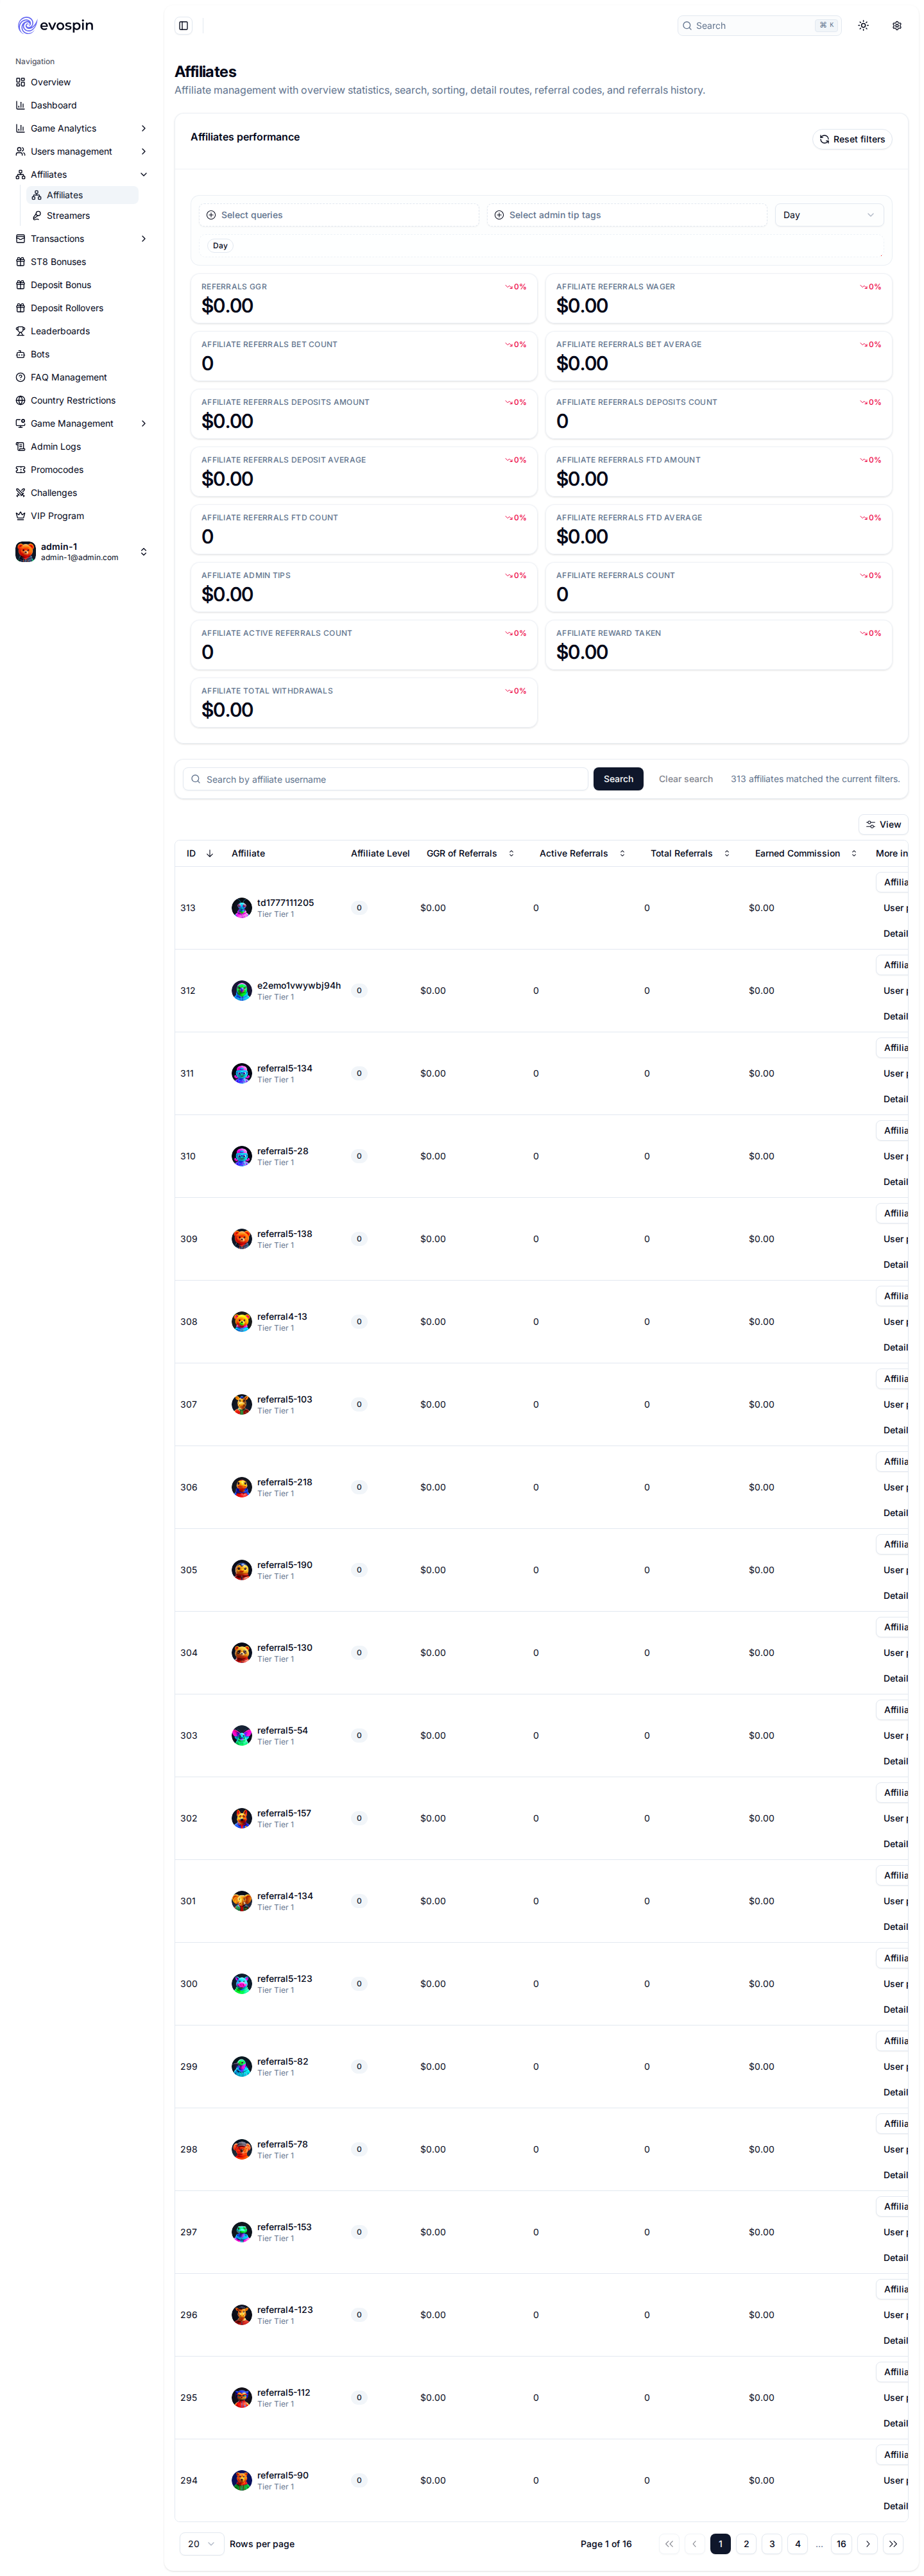
{result,query}[] scoped to referral economics: ReferralGgrQuery, AffiliateReferralsWaggerQuery, AffiliateReferralsBetCountQuery, AffiliateReferralsBetAverageQuery, AffiliateReferralsDeposits{Amount,Count,Average}Query. Same GGR/turnover/bet maths as the games KPIs, restricted to referred users.
Transactions → Withdrawals — GET /admin/payments/withdraw/stats¶
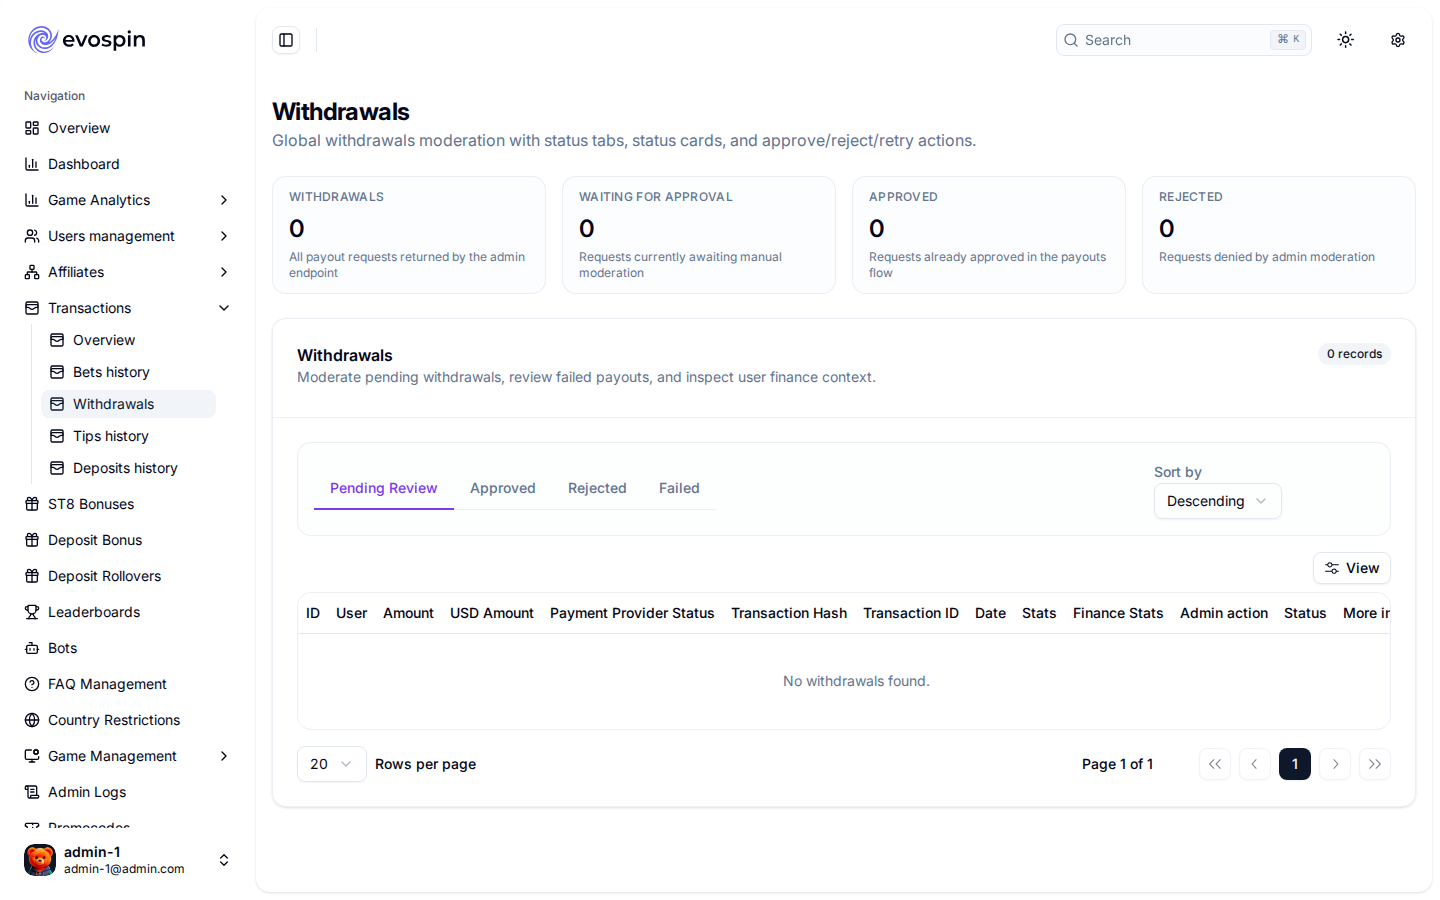
Withdrawal pipeline funnel: { total, waitingForApproval, approved, rejected, failed } — counts by withdrawal state, the queue ops works through. (The table itself is GET /admin/payments/withdraw.)
Country restrictions — GET /admin/country/stats¶
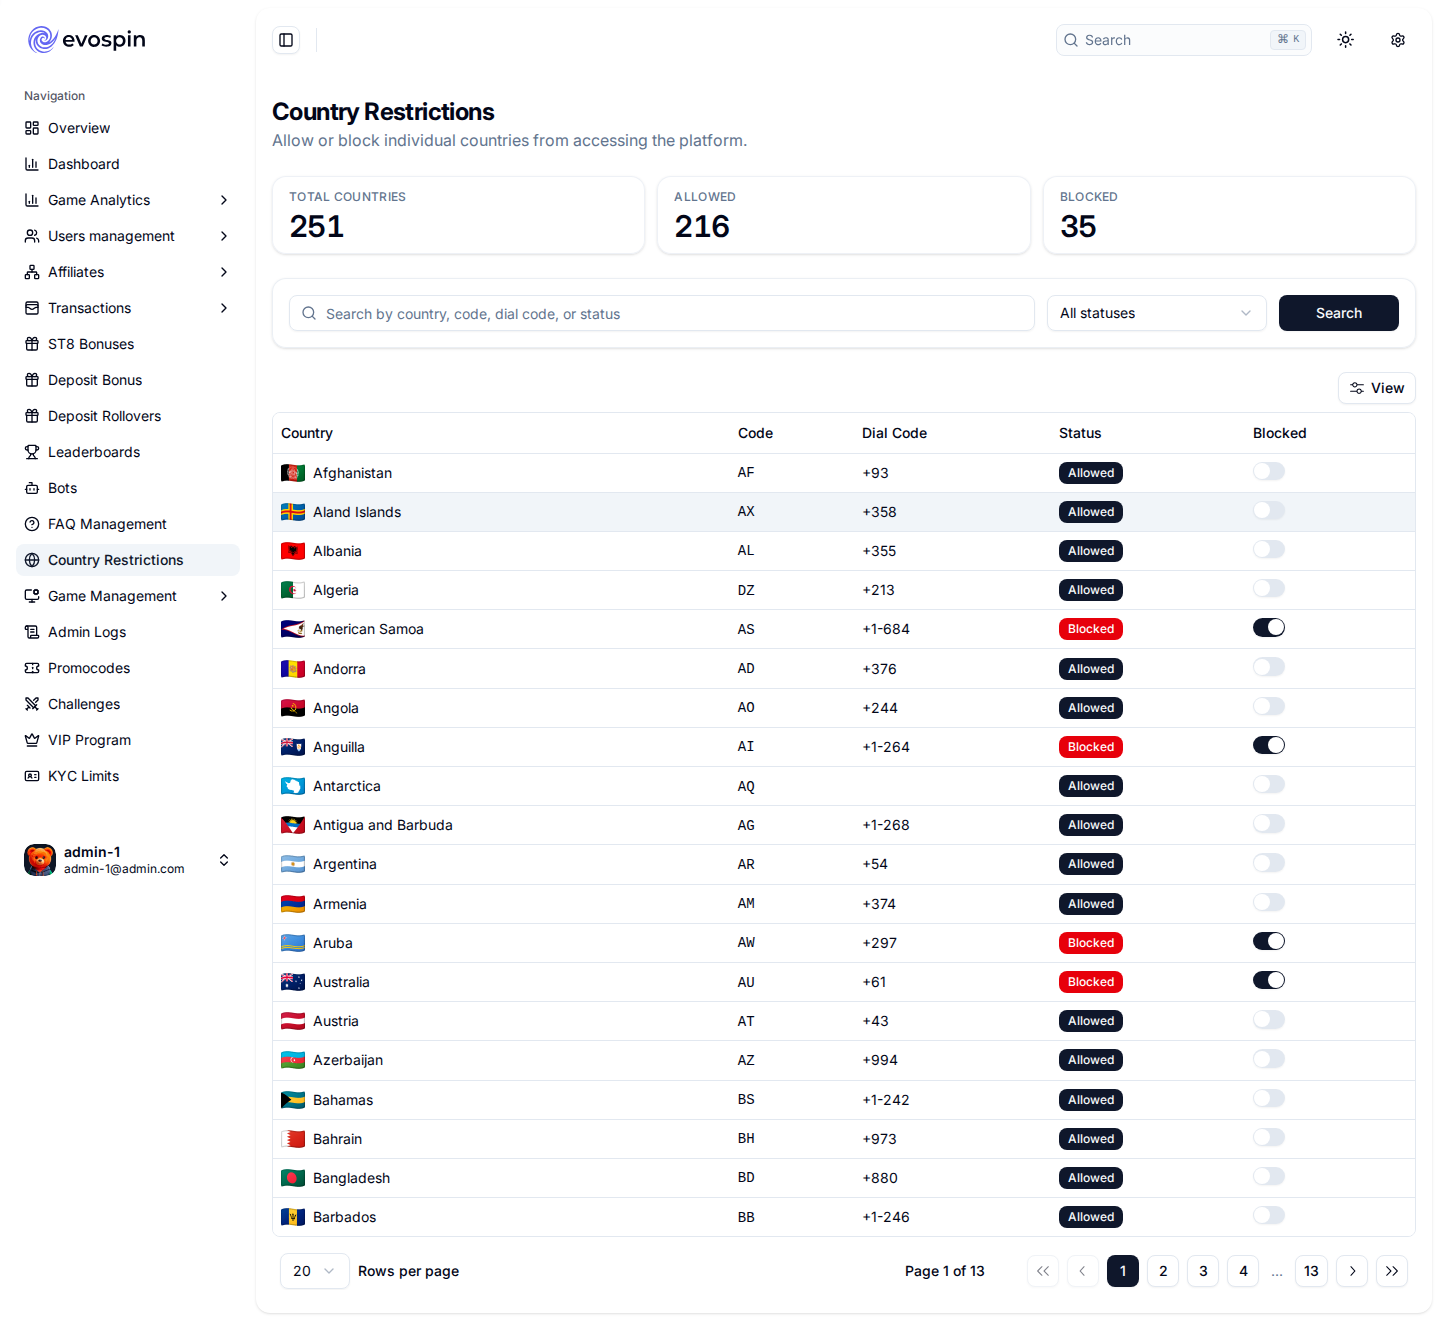
{ total: 251, blocked: 35, allowed: 216 } — geo allow/block split across the seeded countries. This /admin/country/stats endpoint works (200); the list endpoint /admin/country?take=300 is the one that 400s (below).
Provider stats — GET /admin/dashboard/providers-stats (/games/stats/providers)¶
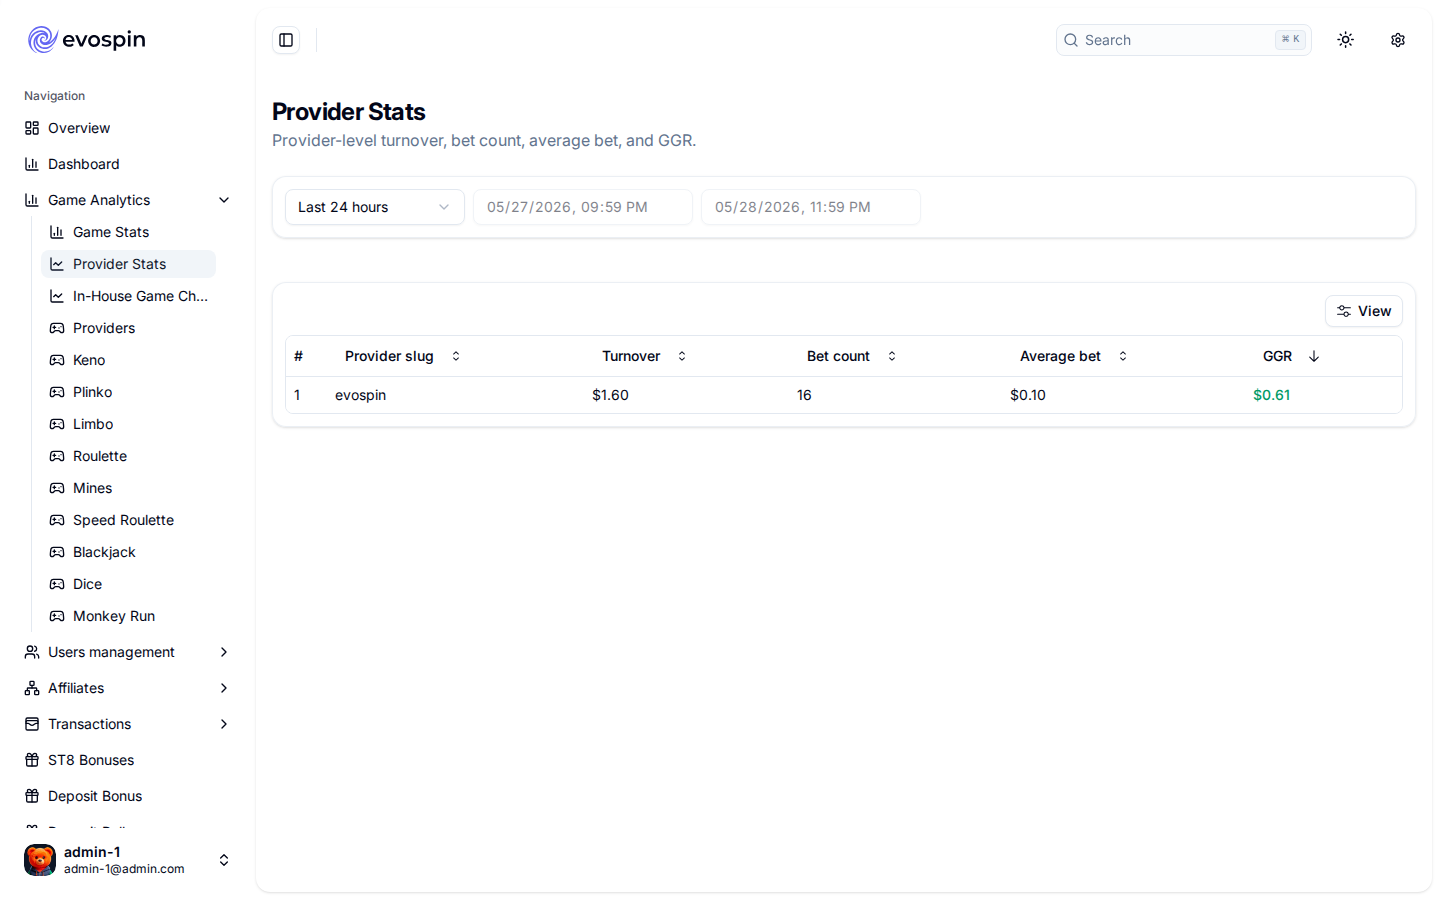
Per-provider performance: [{ provider_slug, sumAmount, countAmount, ggrAmount, average }] — turnover, bet count, GGR, and average bet per provider. Same GGR maths, grouped by provider_slug.
Provider catalog status — GET /admin/casino/games/providers/stats (/providers)¶
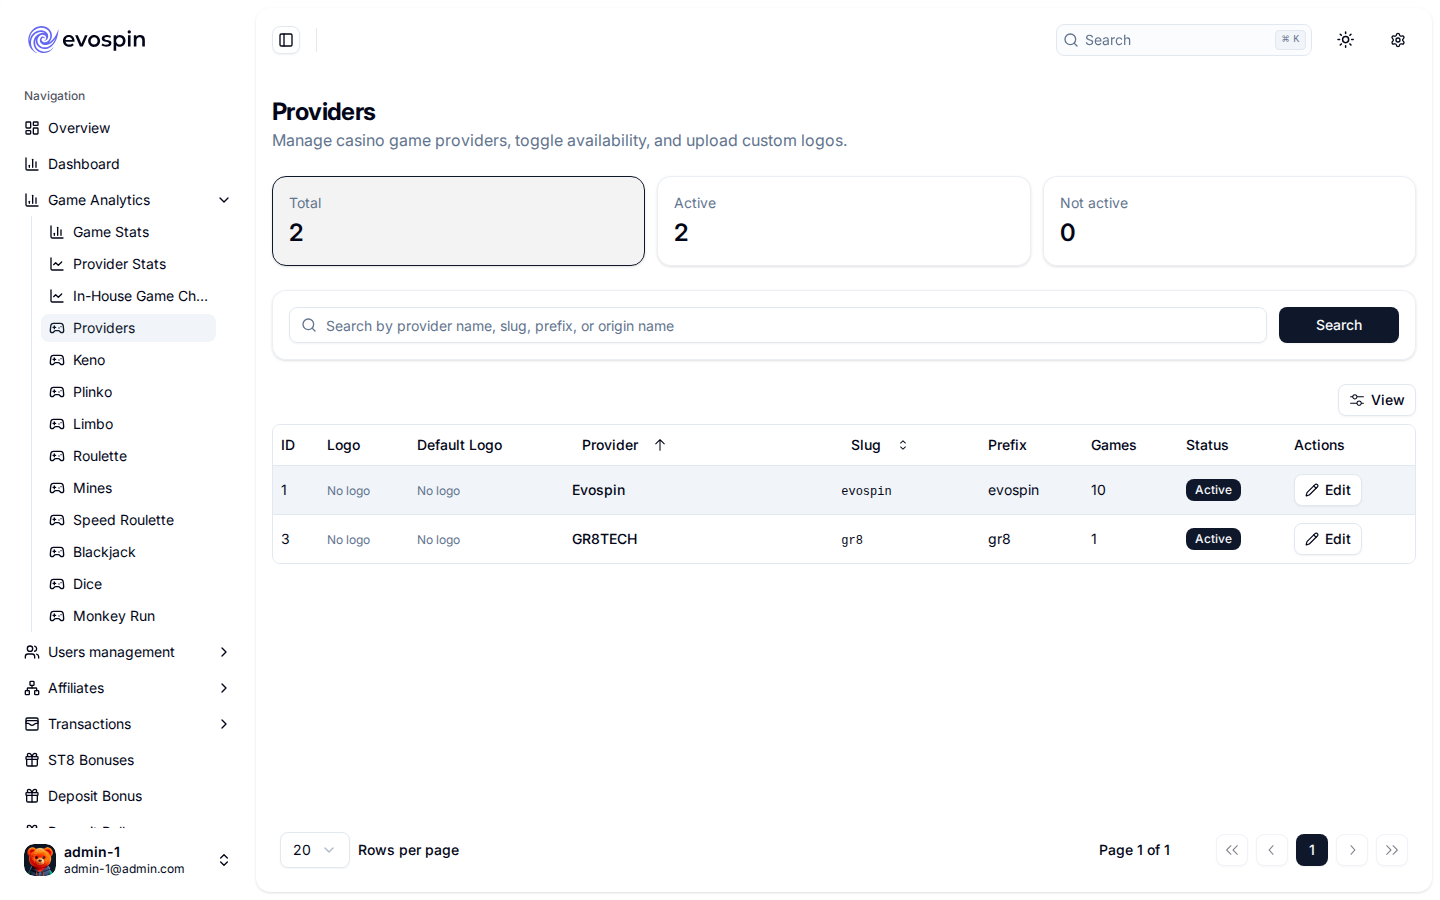
Catalog health: { total: 2, active: 2, inactive: 0 } — how many game providers are wired and enabled.
Games chart — GET /admin/dashboard/games-charts (/games-chart)¶
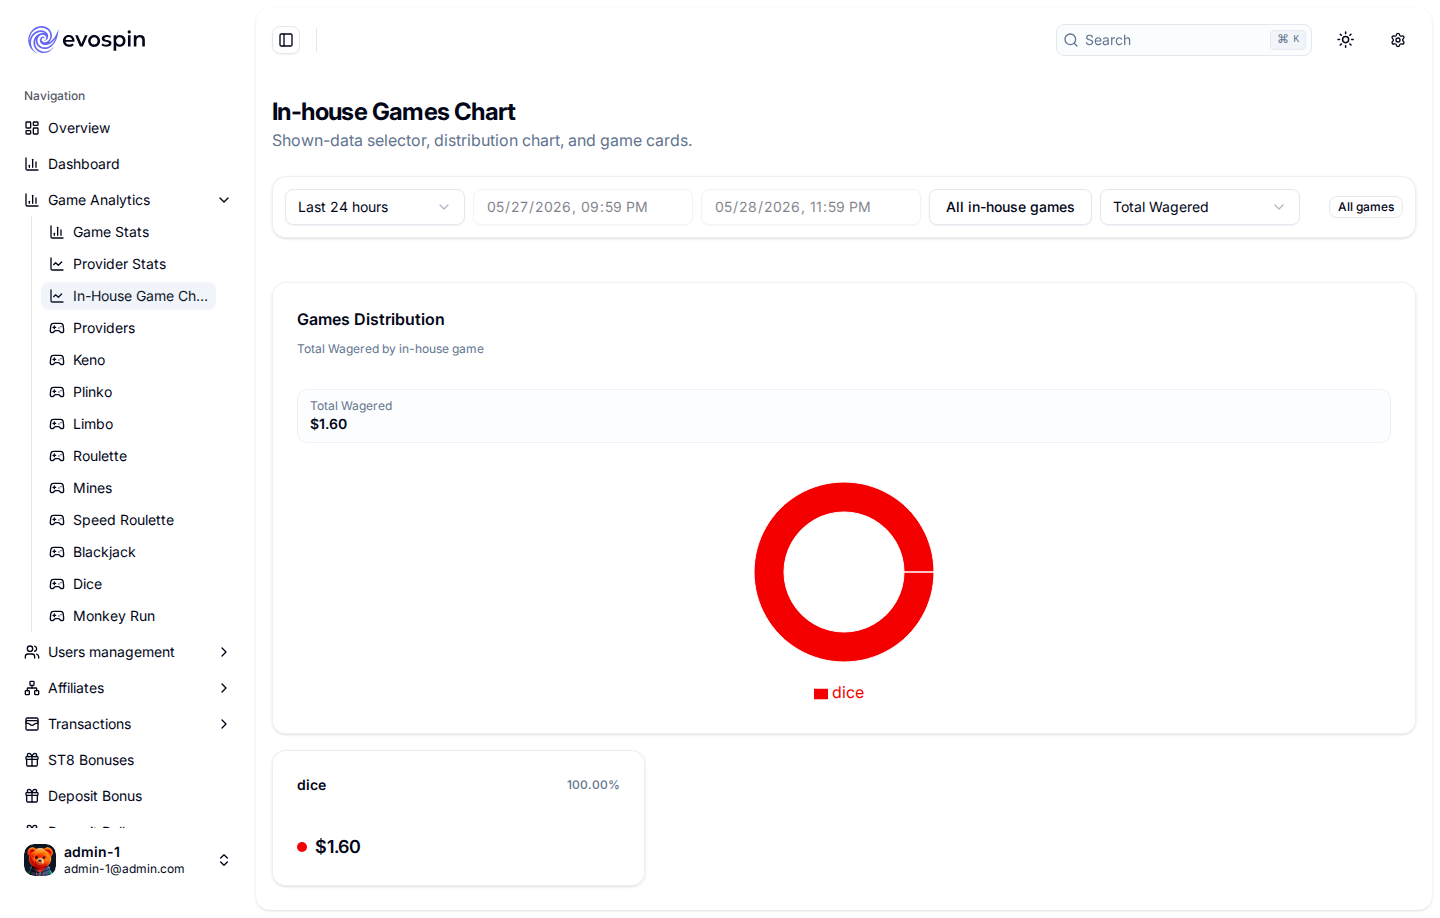
Per-slug chart series: [{ slug, sumUsdAmount, sumUsdPayout, ggr, countBets, averageBet, sumUsdAmountPercentage, sumUsdPayoutPercentage, betsPercentage }]. The *Percentage fields are each slug's share of the total — drives the comparative bar/share visualisation. Lives on its own /games-chart route (not the Game Management landing page), which is why a plain page-load didn't trigger it.
Endpoint reference (captured live)¶
| Endpoint | Feeds | Key params | Status |
|---|---|---|---|
GET /admin/dashboard/quick-stats |
Overview | startDate, endDate | 200 |
GET /admin/dashboard-v2/query/registrations |
Dashboard · General | timeRange, timeGroup | 200 |
GET /admin/dashboard-v2/query/payments |
Dashboard · General | timeRange, timeGroup | 200 |
GET /admin/dashboard-v2/query/bets-by-type |
Dashboard · General | timeRange, timeGroup | 200 |
GET /admin/dashboard-v2/query/games-by-type |
Dashboard · Games (KPI) | timeRange, timeGroup | 200 |
GET /admin/dashboard-v2/query/games-by-slug |
Dashboard · Games (table) | timeRange, timeGroup, gameCategory, orderBy, orderDirection, page, take | 200 |
GET /admin/dashboard/finance-tab |
Dashboard · Finances | startDate, endDate, exclude{Admin,Test,Staff,Streamer} | 200 |
GET /admin/dashboard/games-stats |
Game Management | startDate, endDate | 200 |
GET /admin/dashboard/users-stats |
Users management | startDate, endDate | 200 |
GET /admin/dashboard/affiliate-stats |
Affiliates | startDate, endDate | 200 |
GET /admin/payments/withdraw/stats |
Transactions · Withdrawals | — | 200 |
GET /admin/country/stats |
Country restrictions | — | 200 |
GET /admin/dashboard/providers-stats |
Provider stats (/games/stats/providers) |
period, startDate, endDate | 200 |
GET /admin/casino/games/providers/stats |
Provider catalog (/providers) |
— | 200 |
GET /admin/dashboard/games-charts |
Games chart (/games-chart) |
period, startDate, endDate, games[] | 200 |
GET /admin/country |
Country list | page, take | 400 — see below |
Coverage: all 16 admin analytics/stats endpoints captured live (200). The only non-200 is the /admin/country list (a take cap bug, below) — every stat endpoint works.
Known bug — country stats take cap¶
GET /admin/country?page=1&take=300 returns 400 take must not be greater than 20. The admin-fe requests take=300 but the DTO caps take at 20. Country geo-stats therefore never load. Fix: raise the DTO cap for this endpoint, or have the FE paginate at ≤20.
How it was captured¶
Driven through the real admin-fe UI (Playwright, admin-1 + TOTP login), navigating each tab while recording every :4000/admin/* XHR (request params + response body) and full-page screenshots. The metric formulas were then cross-referenced against apps/api/src/dashboard-v2/repository/common.sql.ts and the CQRS query handlers under apps/api/src/dashboard/repository/query/.